Costco Wholesale Corporation (NYSE:COST) will be reporting its first-quarter earnings on Thursday. Wall Street expects $3.79 in EPS and $62.08 billion in revenues as the company reports after market hours.
The stock is up 58.01% over the past year, 53.50% YTD.
Let’s look at what the charts indicate for Costco stock and how the stock currently maps against Wall Street estimates.
Read Also: Costco Q1 Earnings Preview: Membership Fee Increase In Focus With Shares At All-Time Highs
Costco Stock Bullish But Overbought Ahead Of Q1 Earnings
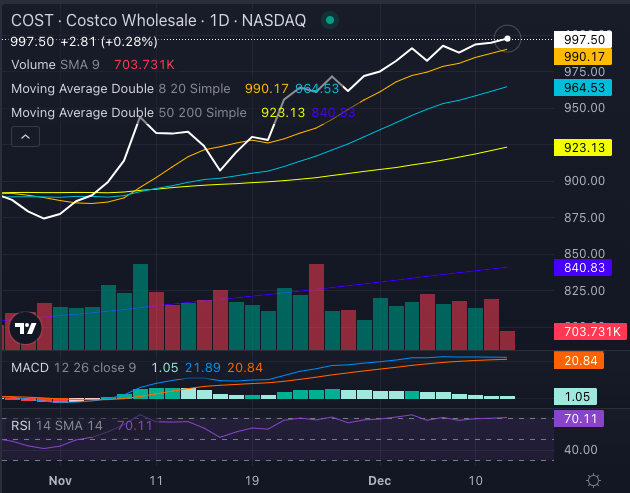
Costco stock displays a mixed technical picture despite a strongly bullish trend with its share price of $994.69 trading above the five-, 20- and 50-day exponential moving averages.

Chart created using Benzinga Pro
This positioning generates several bullish signals, including the eight-day simple moving average (SMA) at $990.17, the 20-day SMA at $964.53, the 50-day SMA at $923.13 and the 200-day SMA at $840.83.
The moving average convergence/divergence (MACD) indicator at 21.98 further reinforces the bullish outlook. However, selling pressure has emerged, coupled with a relative strength index (RSI) of 70.11, which lies in the overbought territory. This combination suggests potential risk of bearish movement despite the current bullish momentum.
Costco Analysts See 7% Upside
Ratings & Consensus Estimates: The consensus analyst rating on Costco stock stands at a Buy currently with a price target of $954.38. The latest analyst ratings from Oppenheimer, Jefferies and Stifel give Costco stock a 7.01% upside with an average price target of $1,073.33.
COST Price Action: Costco stock is up 0.46% at $999.30 Thursday at publication.
Read Next:
- Costco Earnings Are Imminent; These Most Accurate Analysts Revise Forecasts Ahead Of Earnings Call
Photo: Bluestork via Shutterstock


